Reading time: 2 min

Summary algorithms are metrics designed to aggregate and simplify multiple physiological and behavioral measurements into three easy-to-interpret outcomes. These scores are presented on a 0 to 100 scale, where 100 is the ‘best’ attainable score. By presenting data in a reader-friendly format, less experience and time is required to interpret each individual’s status and progress over time, which helps both the end-user as well as any care-takers or data monitors.

Below are the descriptions of each of three main summary scores presented by Biostrap: Activity, Recovery, and Sleep Scores.

Activity Score

Physical activity is a metric that is correlated with numerous health outcomes and diseases. Activity is not exclusive to exercise bouts, and sedentary behavior has also been shown to be associated with health outcomes.

Therefore, Biostrap calculates activity score using the activity distribution over the course of a 24-hour window, emphasizing consistent physical activity of 500 steps per hour during 12 unique hours. Additionally, energy expenditure relative to the user’s goal contributes to the activity score. The energy expenditure goal, or workout calories, can be modified in the Settings tab on the user application.

The Biostrap Buzz

Sign up to our email newsletter to receive curated content on the latest news in digital health and health optimization. Plus, special access to Biostrap offers and community updates.

Recovery Score

The recovery score is computed based on sleep data, with weighted inputs including relative resting heart rate and heart rate variability values. The Biostrap Recovery Score assesses a user’s daily value compared to a personal 5 to 30-day baseline to better understand an individual’s physiological recovery and readiness to perform.

Measures of various sleep parameters, such sleep duration, sleep latency, and the number of sleep disruptions also contribute to the overall Recovery Score calculation.

Sleep Score

The Biostrap Sleep Score includes a comprehensive analysis of over a dozen sleep parameters, including but not limited to nocturnal biometrics, sleep duration, sleep quality, awakenings, and movement.

The Sleep Score incorporates a global and individualized penalty system for calculating the score; for example, if an individual has oxygen saturation values below 90%, the algorithm will apply a global penalty. However, if an individual has an oxygen saturation within the normal range but just slightly below the trailing average over the last 30 days, they will receive a minor ‘relative’ penalty.

Ready to start tracking your Sleep and Recovery? Join our Biostrap family and get started with our Recover Set.

Reading time: 2 min

What is it

Sleep latency is the term given to describe how long it takes to fall asleep. Sleep latency can vary greatly due to behaviors before bedtime, such as alcohol, medications, exercise, diet, and blue light exposure, among others.

However, tracking sleep latency can provide additional insight to help reflect on health, behavior, and intervention changes.

How is it measured

Sleep latency is measured in minutes from the time an individual attempts to fall asleep to the time when the individual enters the first stage of sleep.

Tracking changes in physiological metrics through photoplethysmography (PPG) and accelerometry provides improved insight as individuals may have difficulty reporting the time of initial sleep onset. By tracking metrics such as heart rate, heart rate variability, respiration rate, and limb movements, a good understanding of bedtime and onset of sleep can be made.

The Biostrap Buzz

Sign up to our email newsletter to receive curated content on the latest news in digital health and health optimization. Plus, special access to Biostrap offers and community updates.

Correlations to health conditions

It is important to note that directionality and magnitude of latency may or may not have clinical relevance based on an individual’s situation. For example, long sleep latencies can be indicative of disorders, particularly related to stress or insomnia. However, shortening sleep latency may not reflect positive changes, as high amounts of sleep debt decrease sleep latency. Further, substances such as alcohol may reduce sleep latency but may lead to lesser quality of sleep.

Many of the correlations between latency and health are drawn in anxiety and depression. These psychological disorders are relatively common and affect sleep and sleep latency. However, sleep latency is associated with decreased total sleep, where less sleep causes more anxiety and depression.

Thus, it can be essential to monitor sleep latency changes to catch trends before they become problematic.

Normal or acceptable ranges

The National Sleep Foundation acknowledges up to 30 minutes of sleep latency, regardless of age, as appropriate. Sleep latency of 31-45 minutes is listed as ‘uncertain,’ which could be due to individual trends. It stands to reason that very short sleep latency (<5 minutes) could indicate problems with fatigue and sleep deprivation; however, more research is needed on normative values in this range.

Interpreting trends

Although the clinical recommendations remain unclear, tracking sleep latency could benefit most individuals. This metric, inversely associated with total sleep duration, could provide insight into behavioral changes and how they affect sleep architecture.

Should sleep latency trend negatively for an individual, behavioral interventions could be suggested to correct sleep latency and potentially increase total sleep duration.

Reading time: 2 min

What is it?

Sleep duration is simply the amount of time an individual is asleep. This measure is essential to quantify, as it directly impacts physiological and psychological parameters in the short and long term, impacting health, performance, and longevity.

What does it measure?

Sleep duration is the total sum of time spent asleep, regardless of sleep stage. Using combinations of heart rate, heart rate variability, breathing, motion, and pulse waveform data, approximating sleep versus awake time is possible.

Biostrap uses inputs from all the listed measurements to estimate light sleep, deep sleep, and time spent awake; therefore, the reflected sleep duration is the sum of light and deep sleep.

Correlation with health conditions

Total sleep duration is a commonly reported metric and highly correlates with health outcomes. Sleep is vital to regulating biological processes, allowing adaptation, recovery, and preparation. Many repair processes occur during sleep, with surges in growth hormones and reduction in stress hormones.

Physiologically, increased sleep duration has been shown to reduce stress, improve cardiovascular markers (e.g. heart rate, heart rate variability, and arterial stiffness), reduce weight gain, improve immune function, and lower risk of all cause mortality and varying diseases. As such, sleep appears to improve physiological pathways robustly.

In addition to physiological effects, increased sleep has many cognitive benefits, including improved memory, problem-solving, and reaction speed.

Normal or acceptable range

The American Academy of Sleep Medicine recommends at least 7 hours of sleep per night for adults aged 18-60 years. The National Sleep Foundation recommends supplementing this recommendation with 7-9 hours of sleep per night for adults aged 65 years and older.

Biostrap records users’ sleep each night, and from this data, we can gather average values of distinct populations.

The Biostrap Buzz

Sign up to our email newsletter to receive curated content on the latest news in digital health and health optimization. Plus, special access to Biostrap offers and community updates.

Interpreting Trends

Considering the broad health implications associated with sleep duration, tracking sleep duration over time is recommended, so individuals may notice trends in their behavior. Including sleep duration into longitudinal metrics can either explain or rule out other physiological trends and therefore is included in Biostrap biometrics, allowing users and remote monitors to have a broader view of individual health.

Reading time: 2 min

What is deep sleep

Sleep can be broken down into four different ‘stages’ of sleep. Most commonly, sleep is divided into rapid eye movement sleep (REM) and non-REM (NREM) sleep. NREM sleep accounts for most of the sleep (75-80% of total sleep duration), while REM sleep makes up the rest. Within NREM sleep, there are three stages; the first stage is light sleep and is mostly the transitory onset of sleep; the second stage is also considered light sleep but makes up a longer duration than stage 1.

The third and fourth stages are considered ‘deep sleep’ and are characterized by slow brain waves. Deep sleep makes up roughly 13-23% of nightly sleep. It is during these stages that sleep is restorative and leads to many adaptive physiological outcomes that help the body adapt and repair. As such, deep sleep is more important than total sleep time, affecting health outcomes.

How it is measured

Deep sleep is often identified by slow waveforms on an electroencephalogram (EEG), which measures brain wave activity. As an alternative, deep sleep has been shown to have decreased movement and altered vital signs, particularly: lower heart rate, higher heart rate variability, lower blood pressure, lower temperature, and decreased sympathetic activity.

By measuring these changes using wearable technologies (accelerometers and photoplethysmography [PPG]), a close approximation of sleep stage can be made. This technology allows for passive measurement with much less equipment than a traditional EEG or polysomnogram.

The Biostrap Buzz

Sign up to our email newsletter to receive curated content on the latest news in digital health and health optimization. Plus, special access to Biostrap offers and community updates.

Correlation with health conditions

Much like total sleep time, the therapeutic benefits of deep sleep have robust physiological effects across many organ systems. However, deep sleep appears to be a better indicator of the quality of sleep than the total duration of sleep.

Deep sleep has been shown to affect growth hormone production, glucose metabolism, synaptic processes (e.g. learning/memory formation), and immune function changes. Sleep restriction, influencing the duration of deep sleep, has been linked to many adverse health outcomes, including cardiovascular disease, diabetes, neurodegenerative diseases, poor cognitive function, and many more conditions. As such, it is essential to get adequate amounts of good quality sleep, permitting deep sleep.

Normal or acceptable range

Currently, there are not widely accepted values specific to deep sleep. For each sleep session, most individuals have 13-23% of their duration in deep sleep. The recommended amount of deep sleep has not been thoroughly evaluated, but many experts believe it is better to have more than less. It should be noted that exceptionally high amounts of deep sleep may indicate short-term deficiencies.

Interpreting trends

Deep sleep is a complex biometric that is difficult to quantify. EEG devices provide a strong understanding of sleep stages and progressions but are less realistic for an individual on a regular basis. However, using accelerometers and PPG wearables, light and deep sleep can be approximated on a nightly basis and easily tracked over time.

As with total sleep duration, tracking deep sleep can provide insight into its contribution to changes in health-related outcomes. As a more challenging variable to quantify, monitoring deep sleep over time can also provide insight into lifestyle changes and how they affect deep sleep. For example, tracking how a medication affects deep sleep may provide insight into its efficacy or side effects.

Reading time: 2 min

What is it?

Oxygen saturation refers to the percentage of hemoglobin that is bound to oxygen when in the artery. Hemoglobin is the protein in red blood cells that binds oxygen, carbon dioxide, and carbon monoxide. Since arterial blood is on the way to the capillaries from the left ventricle of the heart, a high amount of oxygen is expected on hemoglobin, typically greater than 95% saturation.

This oxygen is what is required for metabolic processes, namely ATP production, which provides the energy necessary for vital function. Reduction in oxygen carrying capacity often results in altered or diminished cellular and bodily functions, which can lead to acute or chronic disorders.

How it’s measured

Oxygen saturation is measured non-invasively by photoplethysmography (PPG). PPG utilizes red and infrared light exposure through the skin, which absorbs much of the light. Each form of hemoglobin (unbound or bound to oxygen, carbon dioxide, carbon monoxide) absorbs wavelengths of light differently.

Oxygenated hemoglobin absorbs more infrared light, whereas deoxygenated hemoglobin absorbs more red light. By understanding the light absorption curves of each kind of hemoglobin at red and IR wavelengths, the amount of oxygen-carrying hemoglobin relative to total hemoglobin can be determined and expressed as a percentage.

Correlation with health conditions

Because normal function depends on aerobic processes, impairment of oxygen delivery can lead to worsening symptoms, diminished function, and decreased ability to recover.

Many clinical settings use oxygen saturation to monitor the severity and progression of illnesses. SpO2 is a predictor of all-cause mortality and mortality caused by pulmonary diseases.

What is a “normal” range?

Oxygen saturation greater than 95% is considered normal. Values between 90-95% represent a slightly blunted capacity to carry oxygen and may or may not indicate a significant deviation from normal. However, oxygen saturation below 90% (hypoxemia) is considered low and usually suggests an abnormality in oxygen handling.

95% = Normal
90-95% = Low
<90% = Hypoxemia

For individuals with chronic lung conditions or breathing problems, these “normal” ranges typically do not apply. In these cases, individuals should consult with their healthcare professional for information on acceptable oxygen levels.

Interpreting trends

Deep sleep is a complex biometric that is difficult to quantify. EEG devices provide a strong understanding of sleep stages and progressions but are less realistic for an individual on a regular basis. However, using accelerometers and PPG wearables, light and deep sleep can be approximated on a nightly basis and easily tracked over time.

As with total sleep duration, tracking deep sleep can provide insight into its contribution to changes in health-related outcomes. As a more challenging variable to quantify, monitoring deep sleep over time can also provide insight into lifestyle changes and how they affect deep sleep. For example, tracking how a medication affects deep sleep may provide insight into its efficacy or side effects.

The Biostrap Buzz

Sign up to our email newsletter to receive curated content on the latest news in digital health and health optimization. Plus, special access to Biostrap offers and community updates.

Biostrap

In a 2018 study, the standard deviation of absolute error in SpO2 values from clinical reference devices was 1.41. Researchers concluded that this preliminary data suggests that this device may be suitable for prospective clinical trials such as evaluating the utility of wearable physiological monitoring in digitally-enabled preventative service models for respiratory disorders.

In another 2018 study published in Circulation investigating the utility of the Biostrap device as a screening tool for Obstructive Sleep Apnea, researchers concluded that the correlation between the Biostrap and clinical reference PSG support further evaluation of wrist-worn health wearables for OSA screening in high risk CVD patients.

Reading time: 2 min

What is it?

Respiratory rate is the rate at which a complete breathing cycle occurs. While voluntary control can take over this, respiratory rate is an autonomic process controlled by the autonomic nervous system. This happens due to many inputs, including the brain’s respiratory center, which collects physiological sensory information throughout the body.

These sensory inputs into the respiratory center of the brain include blood CO2, O2, and pH levels, lung stretch receptors, joint and muscle proprioceptors, other peripheral receptors, and additional information from higher brain centers that process emotion, speech, motor pathways, voluntary control, and more

How is it measured?

Respiratory rate can be measured through photoplethysmography (PPG) by measuring the baseline shifts that occur with breathing. The baselines move up and down in an oscillatory pattern corresponding to the breath cycle.

Correlations with health conditions

Respiratory rate is subject to change and may be an important vital sign to monitor. The two primary drivers of these changes are lung complications and sympathetic stress response.

Alterations to lung function, such as acute respiratory illnesses (pneumonia, upper respiratory tract infection, etc.), acute bronchoconstriction (such as asthma), and chronic illnesses (COPD, emphysema, pulmonary fibrosis, etc.) all can cause impaired gas exchange at the levels of the lung.

This impaired gas exchange leads to acidosis (increased acidity in the blood) and hypercapnia (a condition of abnormally elevated carbon dioxide levels in the blood), which increase the respiratory rate through the respiratory control center. Through different mechanisms, sympathetic stress leads to increased respiratory rate, typically viewed as an anticipatory response to stress.

The Biostrap Buzz

Sign up to our email newsletter to receive curated content on the latest news in digital health and health optimization. Plus, special access to Biostrap offers and community updates.

Normal or Acceptable Range

Breathing rate is individual-specific but can range from 12 to 20 breaths per minute (bpm). Within a particular individual, the breathing rate can stay relatively constant across days at basal levels (coefficient of variation ~ 5%). However, certain factors such as respiratory illness, high levels of fatigue, infection, and more can cause the respiratory rate to change significantly.

Interpreting Trends

This combination of low variability but high responsiveness allows the respiratory rate to be a good indicator of acute problems. For example, the respiratory rate appears to be highly predictive of respiratory infection and responds before a typical diagnosis, which makes for an excellent biomarker for predicting the risk of respiratory infection.

In general, besides acute illnesses, the respiratory rate should remain relatively stable or trend downward with increased cardiorespiratory function.

References

  1. Schaefer KE. Respiratory Pattern and Respiratory Response to CO2. Journal of Applied Physiology. 1958;13(1):1–14. doi:10.1152/jappl.1958.13.1.1
  2. Javaheri S, Kazemi H. Metabolic alkalosis and hypoventilation in humans. The American Review of Respiratory Disease. 1987;136(4):1011–1016. doi:10.1164/ajrccm/136.4.1011
  3. Brinkman JE, Toro F, Sharma S. Physiology, Respiratory Drive. In: StatPearls. Treasure Island (FL): StatPearls Publishing; 2021. http://www.ncbi.nlm.nih.gov/books/NBK482414/
  4. Schelegle ES, Green JF. An overview of the anatomy and physiology of slowly adapting pulmonary stretch receptors. Respiration Physiology. 2001;125(1):17–31. doi:10.1016/S0034-5687(00)00202-4
  5. Bishop B, Bachofen H. COMPARATIVE INFLUENCE OF PROPRIOCEPTORS AND CHEMORECEPTORS IN THE CONTROL OF RESPIRATORY MUSCLES. :10.
  6. Guz A. Brain, breathing and breathlessness. Respiration Physiology. 1997;109(3):197–204. doi:10.1016/S0034-5687(97)00050-9
  7. Miller DJ, Capodilupo JV, Lastella M, Sargent C, Roach GD, Lee VH, Capodilupo ER. Analyzing changes in respiratory rate to predict the risk of COVID-19 infection. PLOS ONE. 2020;15(12):e0243693. doi:10.1371/journal.pone.0243693
  8. Sun G, Okada M, Nakamura R, Matsuo T, Kirimoto T, Hakozaki Y, Matsui T. Twenty‐four‐hour continuous and remote monitoring of respiratory rate using a medical radar system for the early detection of pneumonia in symptomatic elderly bedridden hospitalized patients. Clinical Case Reports. 2018;7(1):83–86. doi:10.1002/ccr3.1922
Reading time: 4 min

What is it?

Heart rate is defined as the number of contractions of the heart, expressed in beats per minute (bpm). The heart rate is a function of local electrical signals in the cardiac cells, neural inputs, and hormonal influence.

Heart rate changes in response to stressors in order to increase circulation of blood, often by increasing cardiac output. This increase in cardiac output helps meet the demands of physiological responses to stress.

Therefore, heart rate can be a valuable metric in understanding the cumulative stress (e.g. emotional and physical stress) that is placed on the body.

How it’s measured

Heart rate can be measured through palpation, electrocardiography (ECG), and photoplethysmography (PPG). Biostrap measures heart rate using PPG, which captures pulse waves of blood flow using red and infrared light. By using the count of pulse waves per unit of time, heart rate in bpm can be obtained.

Heart rate can be measured during activity (active heart rate). However, resting heart rate (RHR) is most often used to clinically assess cardiovascular health, since extra stress on the cardiovascular system is absent. RHR can be subject to acute stress, including observation bias. Therefore, passive collection of RHR through wearables, particularly during sleep, allows for minimizing error that may artificially raise RHR.

Correlation with health conditions

Chronically increased resting heart rate has been correlated with many diseases and their outcomes, particularly hypertension, obesity, cardiovascular diseases, cancer, and metabolic disorders, among others. In many cases, the increased heart rate is not itself a contributor to the disease progression, but rather a signal that there are down-stream effects of the underlying disease.

Acutely increased resting heart rate may be an indication of altered blood flow, reduced plasma volume, psychological stress, activity, infection, and thermal stress. Monitoring heart rate trends can alert when heart rate has changed acutely, but may not be indicative of the cause of the increase. In times where no change in RHR is expected such as during sleep, follow-up evaluation may be warranted.

What is a “normal” range?

<60 bpm = Bradycardia
60-100 bpm = “Normal”
>100 = Tachycardia

A “normal” RHR is considered to be 60-100 beats per minute. Factors that may influence resting heart rate values include:

  • Fitness level
  • Room temperature
  • Body position
  • Emotional stress
  • Body size and/or composition
  • Use of medications

The Biostrap Buzz

Sign up to our email newsletter to receive curated content on the latest news in digital health and health optimization. Plus, special access to Biostrap offers and community updates.

Interpreting trends

Resting heart rate, measured over time, provides insights into cardiovascular changes in response to lifestyle or disease progression. Since RHR responds relatively quickly to lifestyle changes, tracking resting heart rate over time is recommended in order to monitor positive and negative health adaptations.

Although RHR alone is not enough to diagnose any particular disease, the American Heart Association recommends lowering resting heart rate as much as possible. Exercise training, dietary changes, meditation, and reducing stress are examples of ways to reduce RHR. The decrease in heart rate reflects increased cardiovascular efficiency and decreased systemic stress.

Increases in RHR over time could be an indication of negative cardiovascular changes, and may warrant follow-up testing or lifestyle intervention.

Biostrap

In a clinical study, the Biostrap PPG-based resting heart rate measurement matched within 1 +/- BPM to the reference research grade ECG.

In a small real-world cohort of elderly people, the standalone Fibricheck AF algorithm can accurately detect AF using Wavelet wristband-derived PPG data. Results are comparable to the Alivecor Kardia one-lead ECG device, with an acceptable unclassifiable/bad quality rate. This opens the door for long-term AF screening and monitoring.

References

  1. Lakatta EG, Vinogradova TM, Maltsev VA. The Missing Link in the Mystery of Normal Automaticity of Cardiac Pacemaker Cells. Annals of the New York Academy of Sciences. 2008;1123(1):41–57. doi:https://doi.org/10.1196/annals.1420.006
  2. Brack KE, Coote JH, Ng GA. Interaction between direct sympathetic and vagus nerve stimulation on heart rate in the isolated rabbit heart. Experimental Physiology. 2004;89(1):128–139. doi:https://doi.org/10.1113/expphysiol.2003.002654
  3. Furnival CM, Linden RJ, Snow HM. The inotropic and chronotropic effects of catecholamines on the dog heart. The Journal of Physiology. 1971;214(1):15–28.
  4. Sneddon G, Mourik R van, Law P, Dur O, Lowe D, Carlin C. P177 Cardiorespiratory physiology remotely monitored via wearable wristband photoplethysmography: feasibility and initial benchmarking. Thorax. 2018;73(Suppl 4):A197–A197. doi:10.1136/thorax-2018-212555.334
  5. Lequeux B, Uzan C, Rehman MB. Does resting heart rate measured by the physician reflect the patient’s true resting heart rate? White-coat heart rate. Indian Heart Journal. 2018;70(1):93–98. doi:10.1016/j.ihj.2017.07.015
  6. Paul Laura, Hastie Claire E., Li Weiling S., Harrow Craig, Muir Scott, Connell John M.C., Dominiczak Anna F., McInnes Gordon T., Padmanabhan Sandosh. Resting Heart Rate Pattern During Follow-Up and Mortality in Hypertensive Patients. Hypertension. 2010;55(2):567–574. doi:10.1161/HYPERTENSIONAHA.109.144808
  7. Aune D, Sen A, ó’Hartaigh B, Janszky I, Romundstad PR, Tonstad S, Vatten LJ. Resting heart rate and the risk of cardiovascular disease, total cancer, and all-cause mortality – A systematic review and dose-response meta-analysis of prospective studies. Nutrition, metabolism, and cardiovascular diseases: NMCD. 2017;27(6):504–517. doi:10.1016/j.numecd.2017.04.004
  8. Lee DH, Park S, Lim SM, Lee MK, Giovannucci EL, Kim JH, Kim SI, Jeon JY. Resting heart rate as a prognostic factor for mortality in patients with breast cancer. Breast Cancer Research and Treatment. 2016;159(2):375–384. doi:10.1007/s10549-016-3938-1
  9. Hillis GS, Woodward M, Rodgers A, Chow CK, Li Q, Zoungas S, Patel A, Webster R, Batty GD, Ninomiya T, et al. Resting heart rate and the risk of death and cardiovascular complications in patients with type 2 diabetes mellitus. Diabetologia. 2012;55(5):1283–1290. doi:10.1007/s00125-012-2471-y
  10. Jiang X, Liu X, Wu S, Zhang GQ, Peng M, Wu Y, Zheng X, Ruan C, Zhang W. Metabolic syndrome is associated with and predicted by resting heart rate: a cross-sectional and longitudinal study. Heart. 2015;101(1):44–49. doi:10.1136/heartjnl-2014-305685
  11. Lee B-A, Oh D-J. The effects of long-term aerobic exercise on cardiac structure, stroke volume of the left ventricle, and cardiac output. Journal of Exercise Rehabilitation. 2016;12(1):37–41. doi:10.12965/jer.150261
  12. Target Heart Rates Chart. www.heart.org. [accessed 2021 Apr 15]. https://www.heart.org/en/healthy-living/fitness/fitness-basics/target-heart-rates
  13. Reimers AK, Knapp G, Reimers C-D. Effects of Exercise on the Resting Heart Rate: A Systematic Review and Meta-Analysis of Interventional Studies. Journal of Clinical Medicine. 2018;7(12). doi:10.3390/jcm7120503
Reading time: 5 min

What is it?

Heart rate variability (HRV) is a measure of differences in the time intervals between heart beats. Heart rate by itself is the expression of how many contractions of the heart there are in a given unit of time; however, the rate itself is not constant. There is normal fluctuation of time between heartbeats, in a manner that speeds up and slows down heart rate. Therefore, HRV is a quantifiable measure that assesses these differences.

This variation in the time between heartbeats is thought to be a composite measure of parasympathetic and sympathetic neural inputs and hormonal inputs as regulated by the autonomic nervous system. Much is still unknown about the mechanism of action causing variability changes. However, many studies have shown correlations between HRV and diseased states, such as heart disease, Parkinson disease, and cardiovascular disease; emotional stress, such as depression; physical/mechanical stress, such as high-intensity or resistance training; sleep in the context of both acute stress and chronic stress; and meditation whether it’s “inward- attention” or Vipassana meditation. Therefore, HRV is becoming a more common non-invasive measure to examine the physiological state and responses.

How it’s measured

HRV can be measured by use of an electrocardiogram (ECG) or photoplethysmography (PPG). By referencing a common point in the ECG or PPG waveform, the time between each heart beat can be recorded in milliseconds (ms). Collecting each beat-to-beat interval in ms allows us to compute HRV, most commonly reported as rMSSD (root mean square of successive differences)

The rMSSD method of calculation takes each interval, squares the interval, takes the overall mean, and then the square root of that mean is taken. Biostrap computes the rMSSD using this method and remains the standard computational method for HRV. 

More complex measures of HRV, including frequency domain analysis can be performed to get further information out of heart rate patterns, which will be covered in another review. 

Correlation with health conditions

HRV is most notably correlated with stress conditions, such as anxiety disorders, depression, PTSD, and other psychological states, with lower HRV indicating higher-stressed states. The suggested mechanism is an increased sympathetic arousal, which affects HRV; HRV alone does not cause these states, but reflects and provides insight into the heightened stress on the physiological systems, which in turn have effects on other bodily systems, particularly the cardiovascular and endocrine systems. 

Because of the chronic effects of stress, as previously mentioned, HRV has been noted to be a predictor of all-cause mortality and correlated with obesity, cardiovascular disease, cancer, and neurodegenerative diseases, among other health conditions.

What is a “normal” range?

Heart rate variability has a large individual component and is often used to assess changes in health over time (see “Interpreting Trends” below).

Heart rate variability can fluctuate day-to-day based on exposure to stress, sleep quality, diet, and exercise. This leads to low repeatability, and therefore makes normative data difficult to collect.

In general, younger individuals, males, and more active individuals tend to have higher heart rate variability. However, the inter-subject variability tends to be too high to suggest proper normative ranges. This demonstrates a need to track HRV over time to understand the ‘profile’ of an individual.

When considering a normal range, there is not a normal scale of 0-100. HRV scale is 0-255. Many factors influence where your HRV sits on this scale, including; genetics, lifestyle, and age. Once you track HRV over a period of time you will have a baseline HRV. Once a baseline is established you will be able to see how day-to-day internal and external stressors influence your HRV, upward or downward.

Watching your HRV deviate positively or negatively from your baseline is the most important factor to observe. The actual HRV number matters less than how much it has varied from your “normal” baseline.

Interpreting trends

As previously mentioned, HRV is difficult to interpret and generally a nonspecific data point from a single spot check. However, since it is a dynamic measure that responds to various lifestyle factors, tracking HRV over time allows for non-invasive insight into changes in health status or efficacy of certain interventions.

In general, since higher HRV is preferable, a greater ability to manage stress results in an increased HRV. The results of the studies demonstrating the relationship between stress and HRV suggest that interventions aimed at reducing mental and physical stress could increase HRV and minimize day-to-day fluctuations. The increase in HRV itself will not reduce risk and improve health over the long term, but rather, it reflects positive changes in an individual’s physiology.

Biostrap

In a 2018 study, the Biostrap sensor as a wrist-worn device was shown to produce high-quality signals which are useful for the estimation of heart rate variability. 

References

  1. Mccraty R, Shaffer F. Heart Rate Variability: New Perspectives on Physiological Mechanisms, Assessment of Self-regulatory Capacity, and Health Risk. Global Advances in Health and Medicine. 2015;4(1):46–61. doi:10.7453/gahmj.2014.073
  2. Silva LEV, Silva CAA, Salgado HC, Fazan R. The role of sympathetic and vagal cardiac control on complexity of heart rate dynamics. American Journal of Physiology-Heart and Circulatory Physiology. 2016;312(3):H469–H477. doi:10.1152/ajpheart.00507.2016
  3. Dobrek Ł, Skowron B, Baranowska A, Malska-Woźniak A, Ciesielczyk K, Thor PJ. Spectral heart rate variability and selected biochemical markers for autonomic activity in rats under pentobarbital anesthesia. Polish Annals of Medicine. 2017;24(2):180–187. doi:10.1016/j.poamed.2017.01.001
  4. Huikuri HV, Mäkikallio TH. Heart rate variability in ischemic heart disease. Autonomic Neuroscience. 2001;90(1):95–101. (Neural Regulation of Cardiovascular Function Explored in the Frequency Domain). doi:10.1016/S1566-0702(01)00273-9
  5. Alonso A, Huang X, Mosley TH, Heiss G, Chen H. Heart rate variability and the risk of Parkinson disease: The Atherosclerosis Risk in Communities study. Annals of Neurology. 2015;77(5):877–883. doi:https://doi.org/10.1002/ana.24393
  6. Thayer JF, Yamamoto SS, Brosschot JF. The relationship of autonomic imbalance, heart rate variability and cardiovascular disease risk factors. International Journal of Cardiology. 2010;141(2):122–131. doi:10.1016/j.ijcard.2009.09.543
  7. McCraty R, Atkinson M, Tiller WA, Rein G, Watkins AD. The effects of emotions on short-term power spectrum analysis of heart rate variability. The American Journal of Cardiology. 1995;76(14):1089–1093. doi:10.1016/S0002-9149(99)80309-9
  8. CARNEY RM, FREEDLAND KE. Depression and heart rate variability in patients with coronary heart disease. Cleveland Clinic journal of medicine. 2009;76(Suppl 2):S13–S17. doi:10.3949/ccjm.76.s2.03
  9. Sarmiento S, García-Manso JM, Martín-González JM, Vaamonde D, Calderón J, Da Silva-Grigoletto ME. Heart rate variability during high-intensity exercise. Journal of Systems Science and Complexity. 2013;26(1):104–116. doi:10.1007/s11424-013-2287-y
  10. Kingsley JD, Figueroa A. Acute and training effects of resistance exercise on heart rate variability. Clinical Physiology and Functional Imaging. 2016;36(3):179–187. doi:https://doi.org/10.1111/cpf.12223
  11. Hall M, Vasko R, Buysse D, Ombao H, Chen Q, Cashmere JD, Kupfer D, Thayer JF. Acute Stress Affects Heart Rate Variability During Sleep. Psychosomatic Medicine. 2004;66(1):56–62. doi:10.1097/01.PSY.0000106884.58744.09
  12. da Estrela C, McGrath J, Booij L, Gouin J-P. Heart Rate Variability, Sleep Quality, and Depression in the Context of Chronic Stress. Annals of Behavioral Medicine. 2021;55(2):155–164. doi:10.1093/abm/kaaa039
  13. Busek P, Vanková J, Opavsky J, Salinger J, Nevsimalova S. Spectral analysis of heart rate variability in sleep. Physiological research / Academia Scientiarum Bohemoslovaca. 2005;54:369–76.
  14. Krygier JR, Heathers JAJ, Shahrestani S, Abbott M, Gross JJ, Kemp AH. Mindfulness meditation, well-being, and heart rate variability: A preliminary investigation into the impact of intensive Vipassana meditation. International Journal of Psychophysiology. 2013;89(3):305–313. (Psychophysiology in Australasia – ASP conference – November 28-30 2012). doi:10.1016/j.ijpsycho.2013.06.017
  15. Wu S-D, Lo P-C. Inward-attention meditation increases parasympathetic activity: a study based on heart rate variability. Biomedical Research. 2008;29(5):245–250. doi:10.2220/biomedres.29.245
  16. Jarchi D, Salvi D, Velardo C, Mahdi A, Tarassenko L, Clifton DA. Estimation of HRV and SpO2 from wrist-worn commercial sensors for clinical settings. In: 2018 IEEE 15th International Conference on Wearable and Implantable Body Sensor Networks (BSN). 2018. p. 144–147. doi:10.1109/BSN.2018.8329679
  17. Shaffer F, Ginsberg JP. An Overview of Heart Rate Variability Metrics and Norms. Frontiers in Public Health. 2017 [accessed 2021 Apr 14];5. https://www.ncbi.nlm.nih.gov/pmc/articles/PMC5624990/. doi:10.3389/fpubh.2017.00258
  18. Chalmers JA, Quintana DS, Abbott MJ-A, Kemp AH. Anxiety Disorders are Associated with Reduced Heart Rate Variability: A Meta-Analysis. Frontiers in Psychiatry. 2014 [accessed 2021 Apr 21];5. https://www.frontiersin.org/articles/10.3389/fpsyt.2014.00080/full. doi:10.3389/fpsyt.2014.00080
  19. Hauschildt M, Peters MJV, Moritz S, Jelinek L. Heart rate variability in response to affective scenes in posttraumatic stress disorder. Biological Psychology. 2011;88(2):215–222. doi:10.1016/j.biopsycho.2011.08.004
  20. Cohen H, Kotler M, Matar MA, Kaplan Z, Miodownik H, Cassuto Y. Power spectral analysis of heart rate variability in posttraumatic stress disorder patients. Biological Psychiatry. 1997;41(5):627–629. doi:10.1016/S0006-3223(96)00525-2
  21. Tsuji H, Venditti F J, Manders E S, Evans J C, Larson M G, Feldman C L, Levy D. Reduced heart rate variability and mortality risk in an elderly cohort. The Framingham Heart Study. Circulation. 1994;90(2):878–883. doi:10.1161/01.CIR.90.2.878
  22. Karason K, Mølgaard H, Wikstrand J, Sjöström L. Heart rate variability in obesity and the effect of weight loss. The American Journal of Cardiology. 1999;83(8):1242–1247. doi:10.1016/S0002-9149(99)00066-1
  23. Stein PK, Reddy A. Non-Linear Heart Rate Variability and Risk Stratification in Cardiovascular Disease. Indian Pacing and Electrophysiology Journal. 2005;5(3):210–220.
  24. Sandercock G. Normative values, reliability and sample size estimates in heart rate variability. Clinical Science. 2007;113(3):129–130. doi:10.1042/CS20070137
 

Reading time: 2 min

What is it?

Active heart rate is the rate at which the heart beats during activity or exercise. Heart rate is a highly responsive physiological measure. It is important to note that heart rate is a response variable to many factors. Therefore, the purpose of measuring heart rate is to measure the body’s physiological reaction to the work being performed.

How is it measured?

There are many ways to measure heart rate during physical activity, but some are more reliable than others. The typical ‘gold standard’ method is through electrocardiography, whether 12-lead or single-lead.

Additionally, photoplethysmography, or PPG, can be used to measure pulse waves to obtain heart rate. Due to the nature of different wavelengths utilized during PPG measurements, green light LED has been shown to be best at detecting pulse waveforms during exercise. Red and infrared light are motion intolerant and are not recommended for active heart rate monitoring.

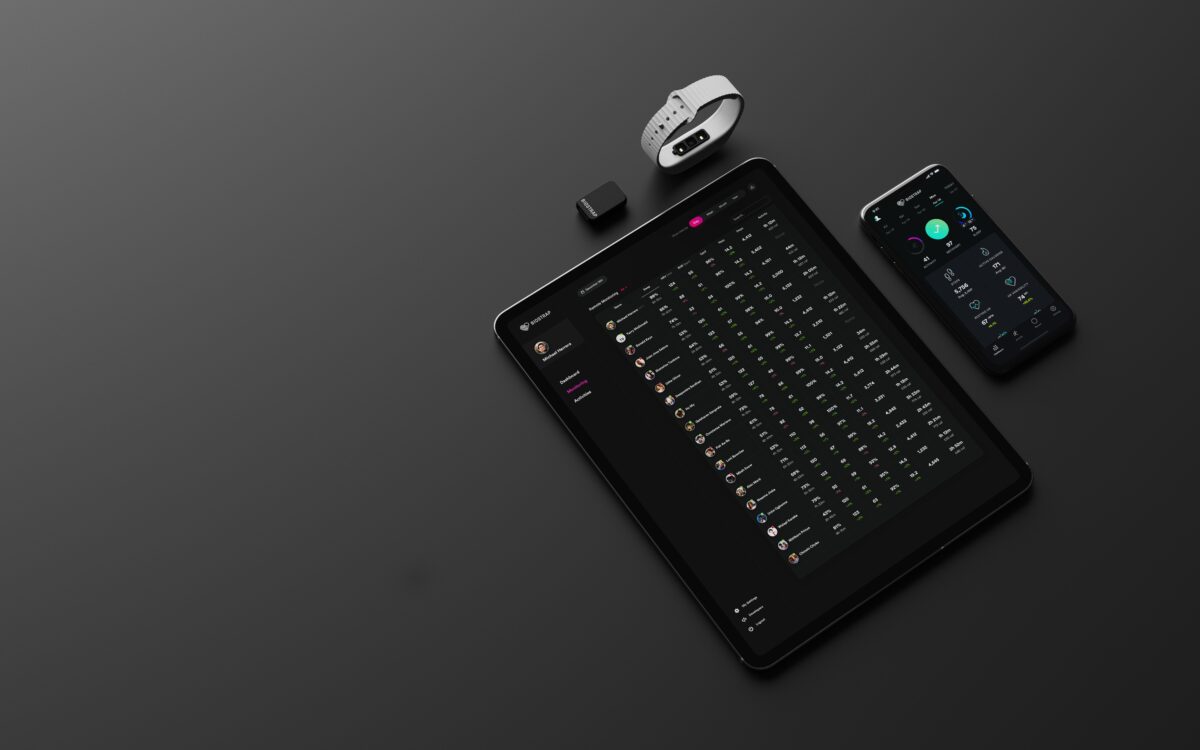
The Biostrap ecosystem contains both a chest-worn ECG-based heart rate monitor as well as a green light PPG sensor worn on the arm. The Biostrap activity HRMs are recommended for use during activity to obtain proper active heart rate. The Biostrap EVO device, equipped with red and infrared PPG does not record during exercise due to motion artifacts; therefore, it’s best utilized for monitoring sleep and recovery metrics captured overnight.

Correlation with health

The use of heart rate during activity and exercise is not recommended for or capable of diagnosing medical conditions. However, heart rate during activity and exercise can provide a lot of information about heart health and performance.

Typically, when examining individuals during exercise, a lower heart rate at an equivalent workload suggests increased cardiovascular health.

The Biostrap Buzz

Sign up to our email newsletter to receive curated content on the latest news in digital health and health optimization. Plus, special access to Biostrap offers and community updates.

Normal Values

In theory, any value existing between resting heart rate and maximum heart rate, or MHR, are ‘typical’ values for exercising. MHR is considered the upper limit of what your cardiovascular system can handle during physical activity.

To roughly calculate your individual MHR, perform the following equation: 220 minus your age.

Interpreting Trends

In general, performing the same task, an individuals’ heart rate should be lower after cardiovascular fitness adaptations.

However, many variables can influence heart rate during exercise that may alter this trend. Heat, emotional stress, caffeine consumption, movement economy, and dehydration are just some of the factors that can influence day-to-day variation in exercise heart rate at the same workload. Cardiovascular adaptations may decrease the reactivity of heart rate to some of these influences, so a trend toward a lower heart rate should still be observed over time.

Note, this should not be confused with active heart rate during a single exercise bout. Heart rate should remain proportional to intensity, and thus depends on the workload applied to the activity.

Did we miss anything?

If you have any questions, suggestions or topic requests, please reach out.